Hello everyone.
This website (Beautiful JavaScript Charts & Graphs | 10x Fast | 30 Chart Types) has great graphics. For example (JavaScript Multi Series Area Charts | CanvasJS) like this:
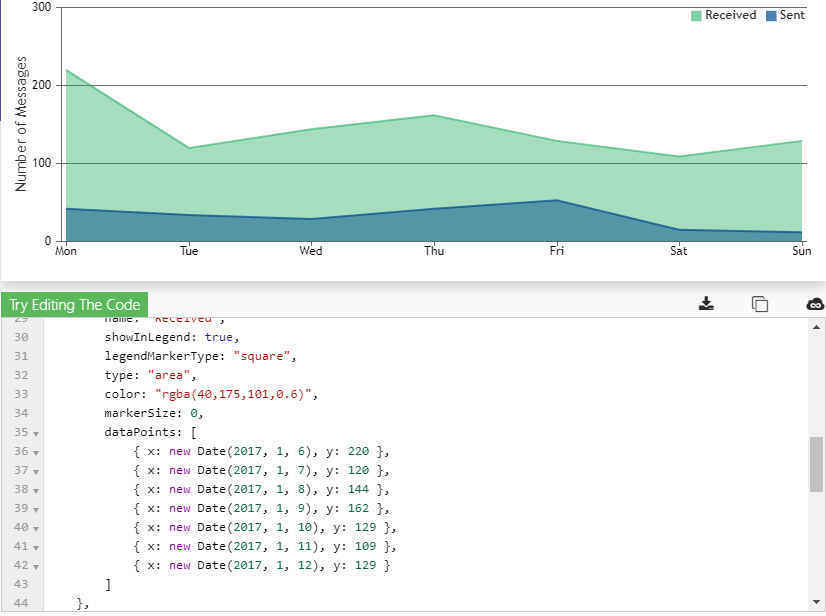
But I don’t want to use the default values in the picture:

Instead, I want to enter my own values. For example, when I enter these values into the textbox and then click a button, I want this graph to appear. Unfortunately, I don’t know what the appropriate blocks are to be able to do this. Can someone help me with this? The sample blocks would be great. Thank you very much in advance. (Besides, I’m sorry I’m not good at English.)