My app is experiencing high data usage (~67 MB to 130 MB) immediately upon opening the screen. I am trying to build a user feed, but the data usage is much higher than the actual size of the data being fetched.
What I have already done to fix it:
Persistence: Unchecked (Disabled) in Designer.
Project Bucket: Set to accounts in Designer, but I keep it empty in the blocks to use full paths.
Fetching Method: I am using join blocks (e.g., accounts/userid/picture) to fetch specific tags instead of downloading the whole bucket.
Loops: I moved the Set Project Bucket block outside of my For Each loop to prevent multiple connections.
Screens: I checked all other screens for hidden Get Tag List calls.
My Structure:
accounts > [UserIDs] > [Name, Picture, Messages, Interests]
Question:
Why is the component still “syncing” so much data? Is there a hidden child-listener active? or is there a fix for the Firebase component
Definitely you’re calling Firebase too much, i recommend the Metric Rat guide, whereby you can use web component to call everything once and purse it as you want METRIC RAT AI2 - Firebase with a Web Component
Hi dear,
first of all, could you better specify what you mean by data usage?
Maybe include a screenshot of the section
I assume you’re referring to downloads, which shows how much data the database has sent to the various clients
What Ibrahim said is true, it’s not an efficient way to call the database.
Imeaned when I open my app and scrolls it’s not jumbing data he data usage everytime this aspecific time it jumbs to 130+
Also itried this method web and all data call ones and retrieve through dictionary then after in just 3 minutes today iused my app now 60 mb crossed
I can’t understand exactly what you mean, can you try give an AI (not recommended) to analysis your idea? Because am missing something from you.
My only concern is data drain. I am trying to minimize Firebase bandwidth usage and stay within my quota limits by reducing the number of server requests. I want to ensure the app is as efficient as possible regarding data consumption
But what do the Firebase charts show? How much are you consuming on the database?
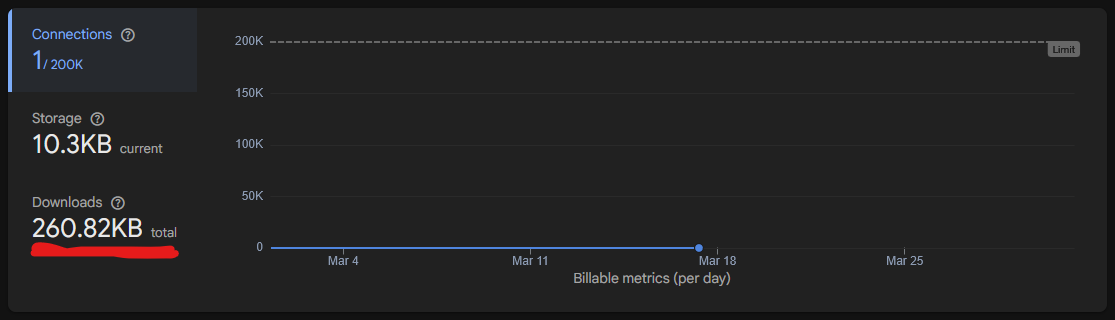
Keep in mind that the free plan allows 360MB per day.

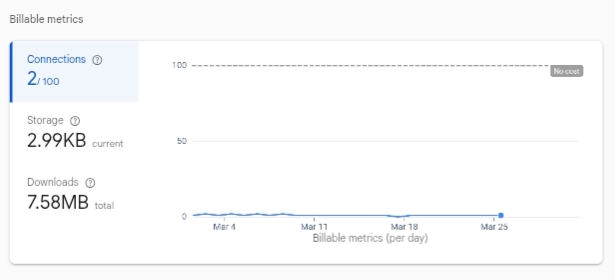
Based on the days shown in the chart, from March 4th to the 25th, you’ve used 7MB.
If you had many users, you would reach the limit quickly.
Are you downloading a lot of data from the database?
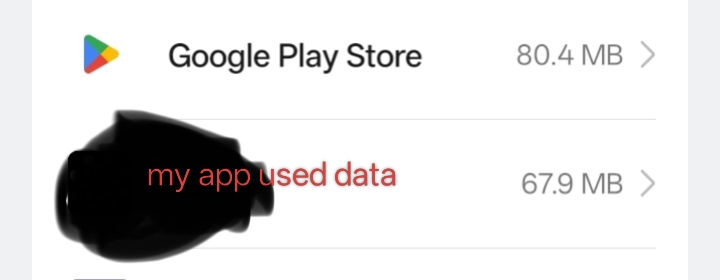
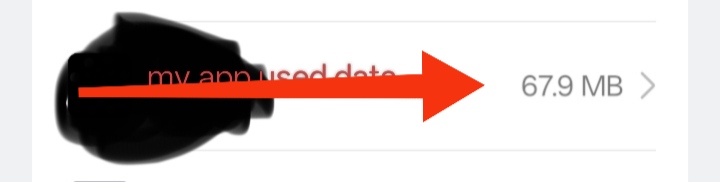
That is exactly my confusion. My Firebase Console chart (which I attached) shows only 7.58 MB total for the month. However, my Android System Data Monitor on my real phone shows that the app used 67 MB in just one session today after opening the Screen.
Here is more detail:
I am fetching a list of users.
I use Get Tag List once, then a for each loop to Get Value for each userid and picture using a specific path (e.g., accounts/user123/userid).
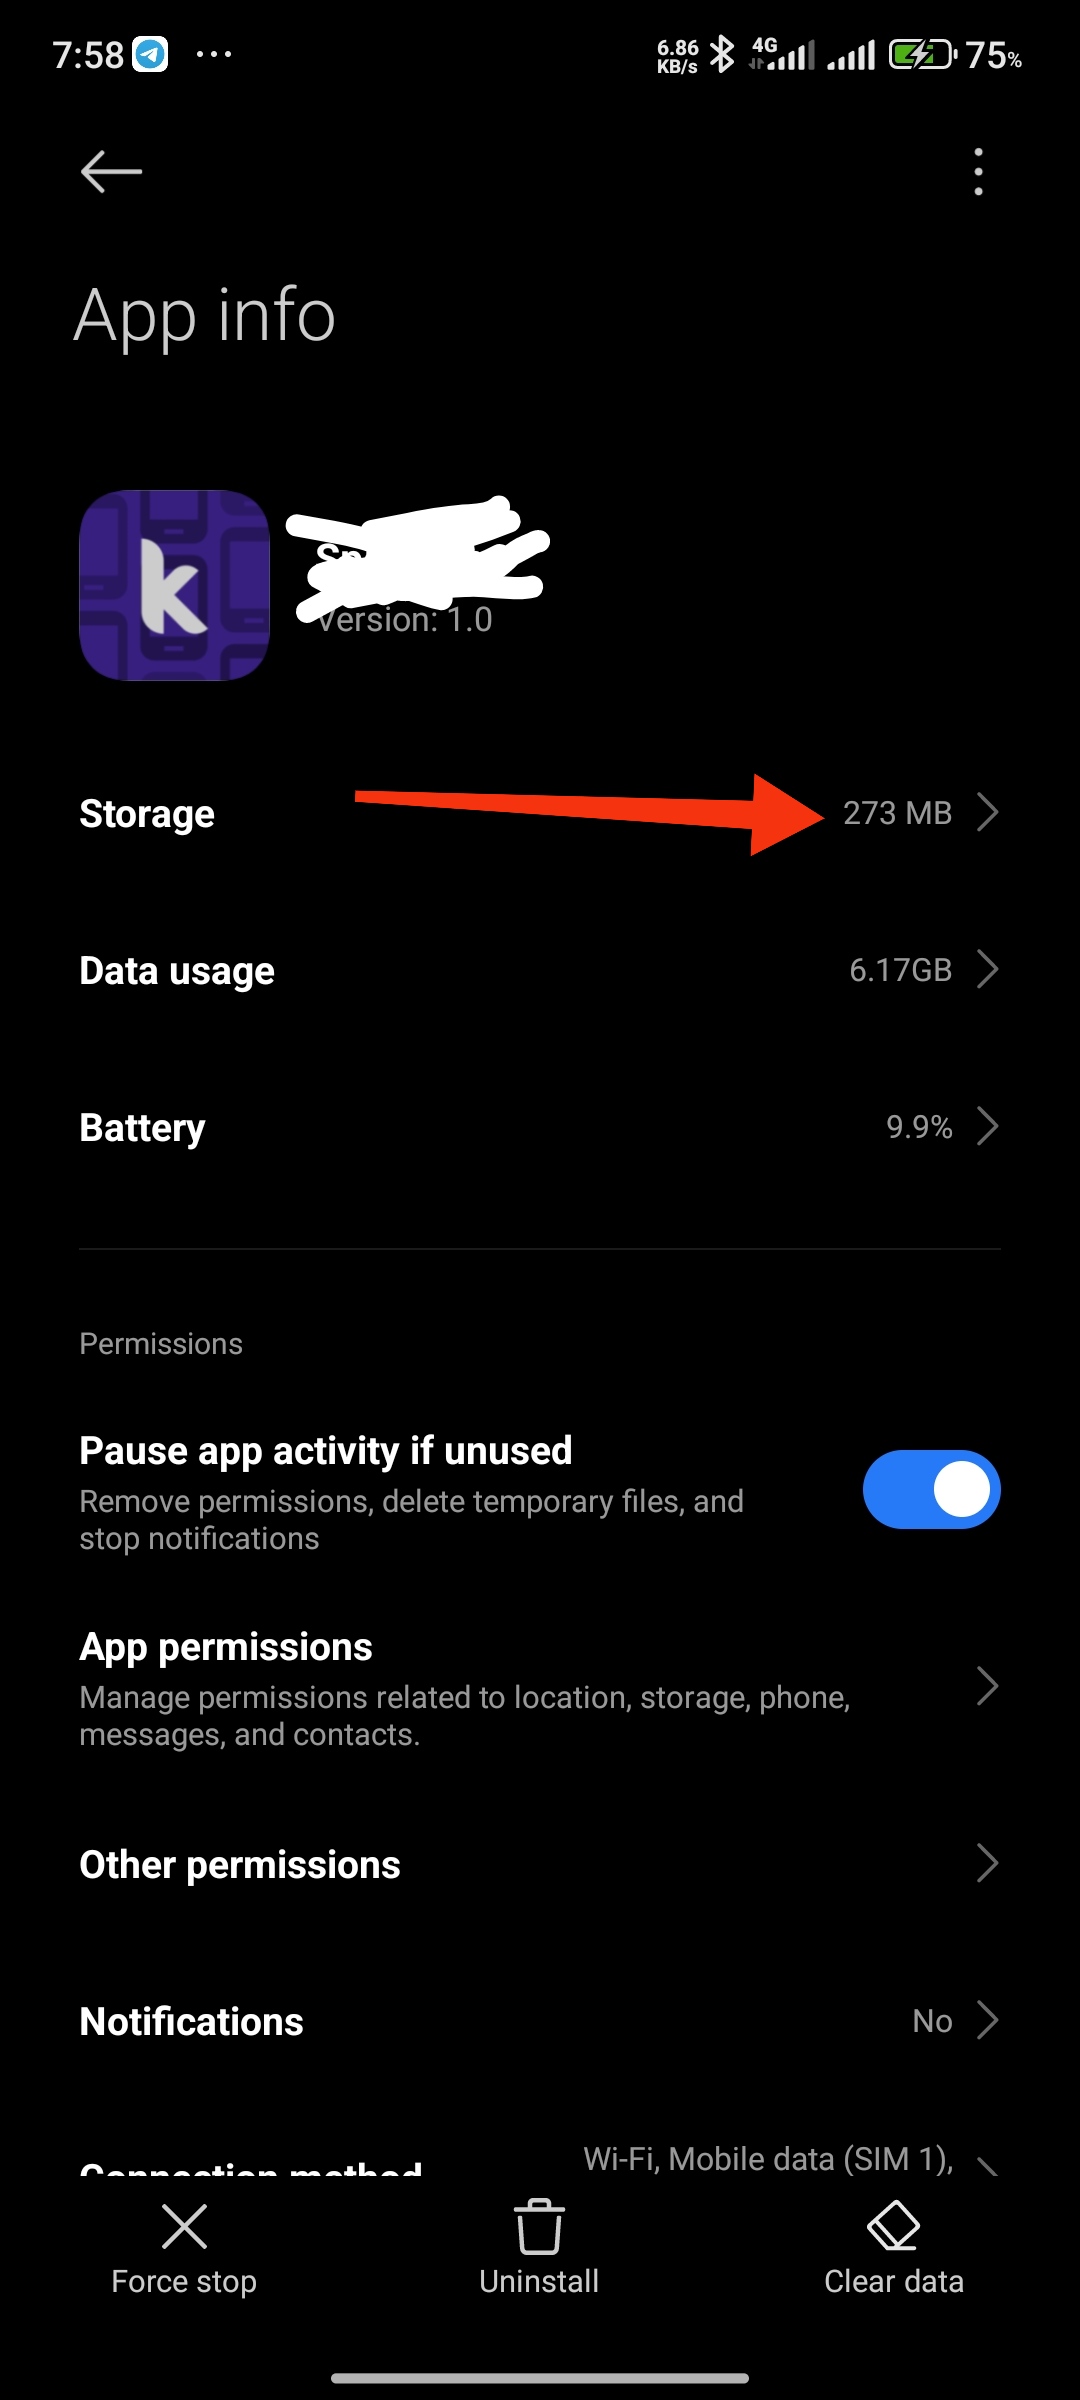
Then your explanation was confused me, the image above isn’t Firebase download usage, that’s apps size, after opening it, maybe you have a lot of assets, store many items in tinyDB, cache, etc, but it’s have nothing to do with Firebase. So I think you should ask why your app size increases not Firebase
See here, ongoing project already consume 270+
The 67 MB is device data usage, not actual Firebase bandwidth.
Possible causes, profile images downloading, hundreds of Firebase requests in loops, firebase realtime syncing, cached files counted by Android,
Hi Ibrahim, thank you for the clarification!
To clarify, the 67 MB I am seeing is under “Mobile Data / WiFi Usage” in the Android System settings, not the “App Info > Storage.” This jump happens specifically during the Screen Initialize when the Firebase loop runs.
You mentioned profile images: I think you hit the point! In my Got Value block, I am fetching the picture tag (Cloudinary/URL) for every user in the loop.
Could the Image component in the Recycler View be auto-caching these images and causing Android to report it as high data usage?
If I have 5 users and I call Get Value for userid and picture separately, that’s 100 requests. Is this “overhead” what’s causing the spike?
I have moved the Project Bucket outside the loop to help, but the spike remains. Do you suggest I fetch only the userid first and load the picture only when the image component enters the screen?
Let’s quickly recap the situation.
You’re trying to optimize Firebase data usage as much as possible, and you’ve noticed that the “My App Used Data” size is much larger than the consumption reported in Firebase.
As Ibrahim explained, the app’s data usage is not directly tied to the Firebase usage you see in the console. That’s because app data includes many additional elements beyond just Firebase network consumption, such as cached files, images, and other locally stored resources.
From what I understand, after the first installation, the app doesn’t take up much space until the user starts scrolling. However, after scrolling through content, the data usage can grow significantly, even reaching around 130 MB.
I see that you’re using RecyclerList and loading images with the DevYB extension, and I believe this is likely the main cause of the issue.
How large are the images you’re loading? If they are the problem, one possible solution would be to generate low-resolution thumbnails. This way, you reduce the initial data usage and storage, and only load high-resolution images when they are actually needed.
Alternatively, you could use a different library or extension that allows you to control the image cache size. For example, you could limit the cache to a fixed size, such as 30 MB, ensuring that image storage never exceeds a defined threshold.
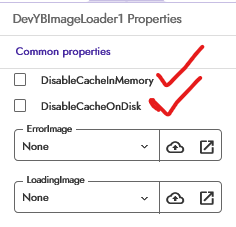
Also try disabling these two option, alse

Don’t store caches from the extension, or use Pagination
100%
Usefull info from AI
Disk cache (DisableCacheOnDisk)
- It is the cache stored in the phone’s internal storage
- It remains even after you close the app
- It helps avoid re-downloading data (images, files, content)
If you enable DisableCacheOnDisk:
- the app won’t save anything to internal storage
- it will have to re-download everything each time
- it will use more data and may load more slowly
- but it will take up less space on the device
Memory cache (DisableCacheInMemory)
- It is the cache stored in RAM
- It is very fast but temporary
- it disappears when you close the app or when the system frees memory
If you enable DisableCacheInMemory:
- the app won’t keep temporary data in RAM
- it may be slower during use (it reloads things more often)
- but it uses less RAM
But if he keep images <100k i think he is safe, but over that it will load random images (waiting the other to complete downloading)
With <100k makes the app to load 5x faster than the first time of launching the app ( size increase after use, i think it will increase by any mean ![]()
Also <70 size is cool, BTW why are you worried about device storage usage?
Thanks for the explanation I was a bit confused about the storage at first but now I understand why the performance is more important. That 5x speed boost is a great point. Thanks for the help